ESSENTIAL QUESTION(S):
1. How can we use science to learn more about the world around us?
2. How does the presence of human’s impact wildlife?
3. How do we “complete” the science cycle?
SUBJECT: Environmental Science
GRADE LEVEL: 5th grade
CONCEPTS:
TIME ESTIMATE: 4 hours and 30 minutes
VOCABULARY:
LESSON OVERVIEW:
This lesson begins with an opportunity to collect data from their track tube experiment. Using the data collected in advance (by the instructor), at the start of this lesson, students will explore and question their results. The class will practice making simple bar graphs and work with the instructor to graph the collected data. Students will use the graphs to answer their hypotheses and ask more questions about the experiment. Students will have the opportunity to be creative by representing any part of the experiment in a skit. The lesson will conclude with students creating and presenting a follow up experiment to address any unanswered questions about their results.
STUDENT LEARNING OBJECTIVES:
Students will be able to:
1. Identify if a track pad was visited by a small rodent.
2. Create a bar graph using the collected data.
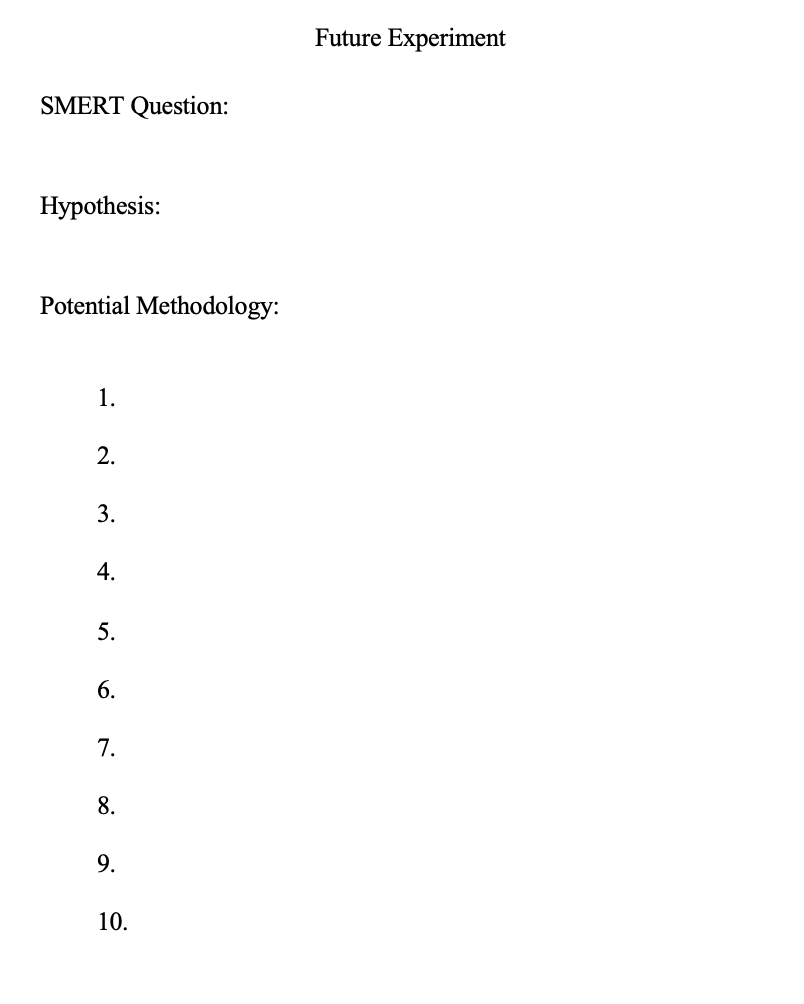
3. Create one SMERT question about the results.
4. Design a follow-up experiment to address their SMERT question.
OPPORTUNITIES TO DIFFERENTIATE:
ADVANCED PREPARATION:
MATERIALS:
BACKGROUND INFORMATION:
In the first lesson, students created track tubes and focused on questioning, hypothesis, and methods. In the second lesson, students then flagged both the plots around the human presence study site and in the forest site and set out the track tubes. All track tubes were collected and reset by the instructor. Data collected by the instructor mid-week and data that will be collected by students will be used for data analysis in this lesson.
ASSESSMENT:
SCIENTIFIC NOTEBOOK EXPECTATIONS:
COLORADO ACADEMIC STANDARDS ADDRESSED:
Standard 2: Life Science-Evidence Outcomes
b. Analyze and interpret data to generate evidence that all organisms have structures that are required for survival in both plants and animals. (DOK 1-2)
TIME ESTIMATES:
1. How can we use science to learn more about the world around us?
2. How does the presence of human’s impact wildlife?
3. How do we “complete” the science cycle?
SUBJECT: Environmental Science
GRADE LEVEL: 5th grade
CONCEPTS:
- Graphing
- Data Analysis
TIME ESTIMATE: 4 hours and 30 minutes
VOCABULARY:
- Bar graph: A visual representation of data represented by rectangles with different heights.
- Axis: Normally there are two on a graph, one going across (x-axis) and one going up and down (y-axis). Axis are labeled and help us understand the number values of the data.
- Track tubes: Data collection devices that can identify presence or absence of small rodents. Made of a PVC pipe with an ink pad and paper inside to record animal footprints.
- Plot: A specific area mapped out with flags.
- Track pads: The strip of cardstock paper that ink footprints show up on.
- SMERT Questions: Scientific questions that are specific, measurable, ethical, reasonable, and able to be answered in the allotted time.
LESSON OVERVIEW:
This lesson begins with an opportunity to collect data from their track tube experiment. Using the data collected in advance (by the instructor), at the start of this lesson, students will explore and question their results. The class will practice making simple bar graphs and work with the instructor to graph the collected data. Students will use the graphs to answer their hypotheses and ask more questions about the experiment. Students will have the opportunity to be creative by representing any part of the experiment in a skit. The lesson will conclude with students creating and presenting a follow up experiment to address any unanswered questions about their results.
STUDENT LEARNING OBJECTIVES:
Students will be able to:
1. Identify if a track pad was visited by a small rodent.
2. Create a bar graph using the collected data.
3. Create one SMERT question about the results.
4. Design a follow-up experiment to address their SMERT question.
OPPORTUNITIES TO DIFFERENTIATE:
- Throughout the lesson:
- Students will have the opportunity to demonstrate understanding through writing, drawing, or verbal responses.
- Students will be allowed to record their future experiment with images or words in their science notebooks. Students also can share verbally with the instructor.
- Students will be allowed to work with a partner when creating their future experiment.
- Students struggling with time constraints for creating a future experiment are allowed to skip creating a hypothesis.
ADVANCED PREPARATION:
- Collecting data and resetting the traps in the middle of the week.
- Between the second and final lessons, the instructor should reset all the traps and collect and sort the first round of track pads.
- Refer to OLS Inquiry 1 for instructions, materials, and advanced preparation for Mouse Mania game.
MATERIALS:
- Collected track pads
- Graph paper
- Small whiteboard
- Whiteboard marker
- Whiteboard eraser
- Magnifying glasses
- Gloves
- Tape
- Scissors
- 6 Shopping bags
BACKGROUND INFORMATION:
In the first lesson, students created track tubes and focused on questioning, hypothesis, and methods. In the second lesson, students then flagged both the plots around the human presence study site and in the forest site and set out the track tubes. All track tubes were collected and reset by the instructor. Data collected by the instructor mid-week and data that will be collected by students will be used for data analysis in this lesson.
ASSESSMENT:
- Students will demonstrate their understanding of the scientific cycle in the summative assessment by designing a second experiment that will answer a SMERT question drawing from the results of the first experiment.
- Students will demonstrate their ability to interpret data by creating a graph in their scientific notebooks.
SCIENTIFIC NOTEBOOK EXPECTATIONS:
- Students will practice collecting basic data and creating a bar graph from that data (see Appendix I).
- Students will record a follow-up SMERT question in their notebooks and design a future experiment to answer their question (see appendix IV).
COLORADO ACADEMIC STANDARDS ADDRESSED:
Standard 2: Life Science-Evidence Outcomes
b. Analyze and interpret data to generate evidence that all organisms have structures that are required for survival in both plants and animals. (DOK 1-2)
TIME ESTIMATES:
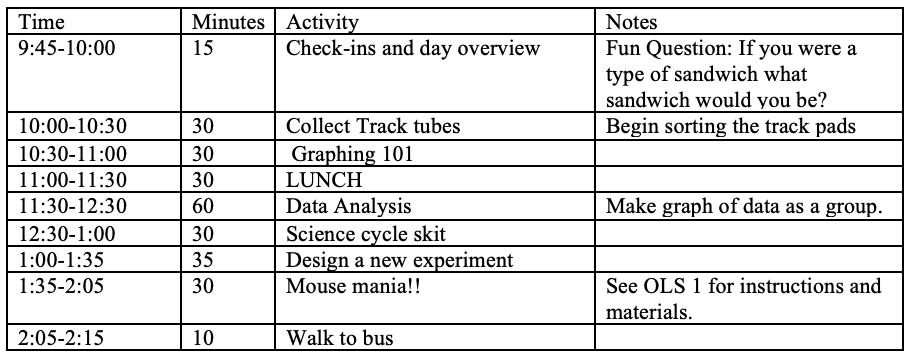
PROCEDURE:
Check In and Norms
Engage: Finding a track tube
Explain: Graphing Lesson
Explore: Data Analysis
Elaborate: Make a science cycle skit as a group!
Evaluate: Summative Assessment
Return to Bus
Check In and Norms
- Check In:
- If you were a type of sandwich, what sandwich would you be?
- Overview of the day.
Engage: Finding a track tube
- Give each student a shopping bag to carry their personal track tubes.
- As a class go on a walk to collect all the track tubes.
- When students collect the tubes and flags marking the location of each tube, they will tape the identifying flag to the outside of each track tube so that the location and bait type is clear.
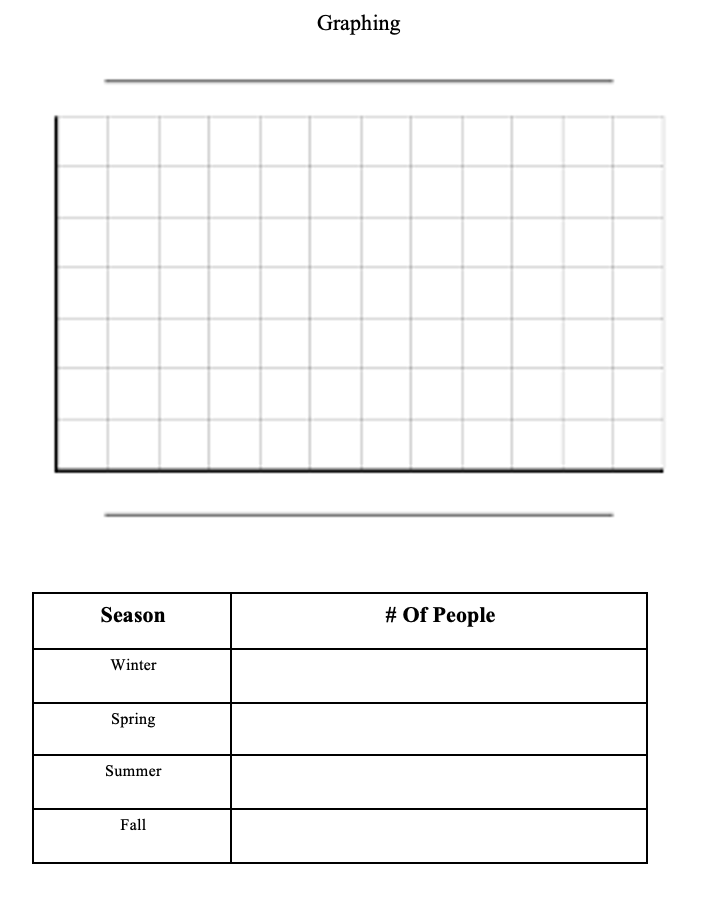
Explain: Graphing Lesson
- Introduce what a bar graph is by drawing a simple example on the white board.
- Point out the parts of a bar graph (title, axis, legend).
- Title: Tells the reader what information is on the graph.
- X-Axis: Horizontal line that often defines the “bars” on the graph.
- Y-Axis: Vertical line that often provides numerical context
- Discuss how numbers should increase by a consistent amount.
- Legend: Can be another way to add detail and describe the information shown on the graph (draw an example of a graph with a legend).
- Point out the parts of a bar graph (title, axis, legend).
- Have students make a basic bar graph in their science notebooks.
- Have students poll each other and fill out responses in the data table. (See appendix I)
- Question: what are our favorite seasons?
- Transfer the data in the table onto the bar graph. (See appendix I)
- Have students poll each other and fill out responses in the data table. (See appendix I)
Explore: Data Analysis
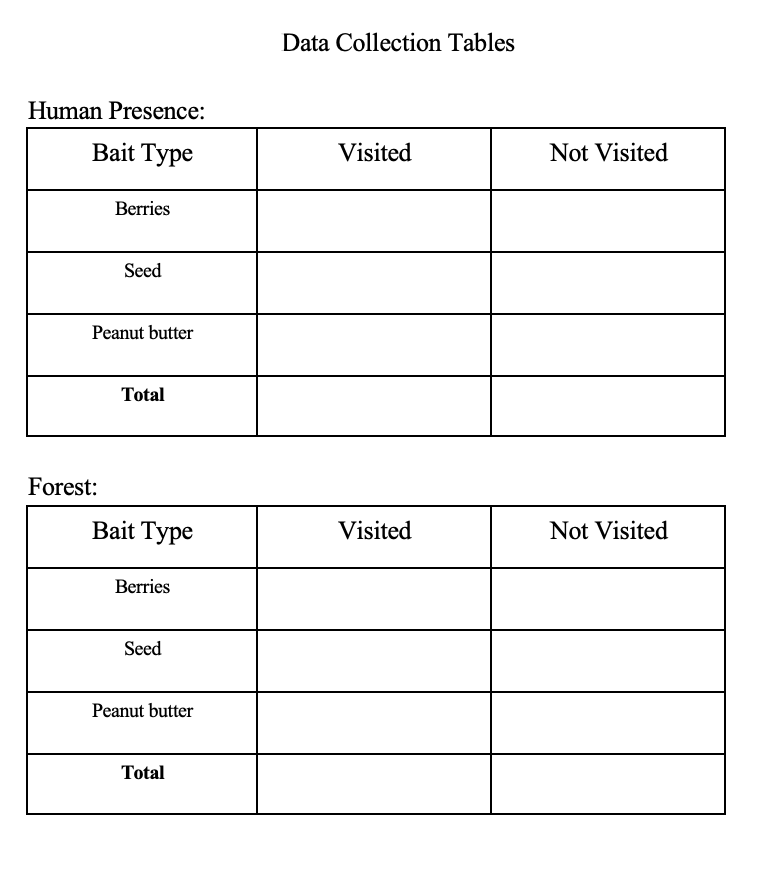
- Organize all the track pads by location and bait type. Record data in data tables (see appendix II).
- Let students look at the track pads and make observations about what they see.
- Ex. Pee, poo, different types of tracks, dirt…
- Instruct half of the students to record data from the building plots and the other half to record data from the forest plots.
- Let students look at the track pads and make observations about what they see.
- As the class, create 1-2 bar graphs that display the data clearly on a white board.
- Ask students if the results support their personal hypothesis
- Sample hypotheses:
- Hypothesis: If there are humans present then there will be less mice because mice fear the noise that humans make.
- Hypothesis: If mice have the option of berries, seeds, or peanut butter, then they will mostly eat berries because it is found in their natural habitat.
- Sample hypotheses:
Elaborate: Make a science cycle skit as a group!
- Students will be asked to work together in pairs and pick one part of our experiment that they want to create a skit about.
- Parts of the experiment: observation, questioning, hypotheses, methodology, data collection, data analysis.
- Students will have 15 minutes to create and practice their skit before performing it.
- This is a fun activity for students to take charge and be creative.
- The instructor is only available to support and answer questions.
Evaluate: Summative Assessment
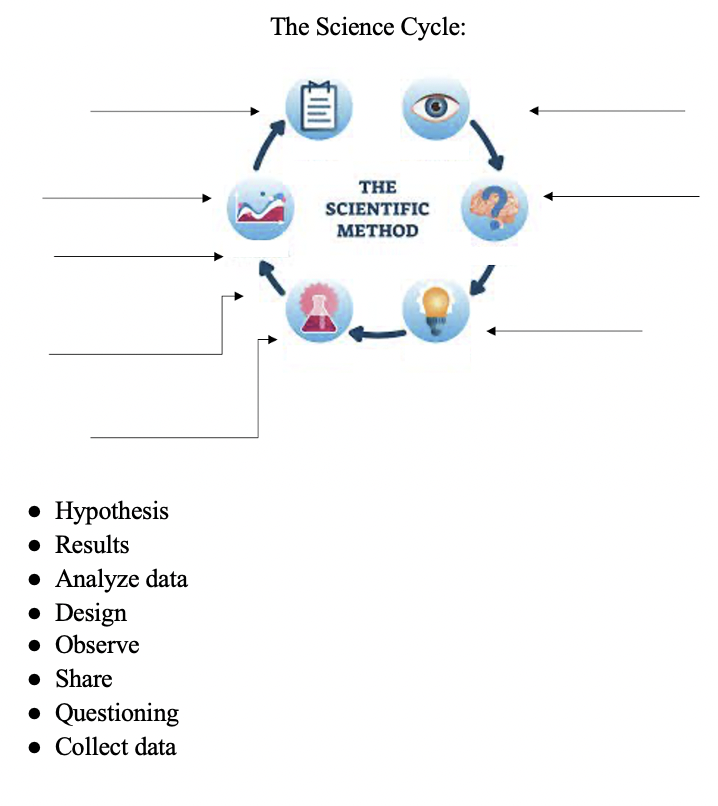
- Revisit the science cycle (see appendix III).
- discuss how a scientist would keep the cycle going.
- What do you think happens after a scientist shares their conclusions?
- discuss how a scientist would keep the cycle going.
- Begin questioning the results with students.
- Try to get as many initial questions as possible.
- Pick one or two good questions to turn into SMERT questions as a class
- Design a new experiment to answer a question about our data. (See appendix IV)
- Students can use one of the SMERT questions we created as a class or come up with their own.
Return to Bus
Appendix I
Appendix II
Appendix III
Appendix IV